The hot window after signup is one day, not three
We grouped 19,597 delivered lifecycle emails by how many hours after signup they were sent. Human opens peak in the first 24 hours, then drop by almost half and stay flat for a week.
- Published 22 October 2026
- 19,597 delivered emails
- Selected sample
- Bot-filtered
- Raw open rate
- Human open rate
At a glance
The numbers worth quoting
Key findings
What the data says
- 1Day one gets 1.7x the opens
24.1% of lifecycle emails sent in the first 24 hours were opened by a person, against 13.8% the next day.
- 2Then opens flatten
From hour 24 to day 7, human opens stay between 13.8% and 15.5%. The drop happens once, at the end of the first day.
- 3Clicks keep falling
Human clicks go from 6.28% on day one to 4.03%, 3.49% and then 2.42% by days three to seven. Interest in acting fades faster than interest in reading.
- 4Not just the welcome email
Without the welcome email, first-day emails still got 18.4% human opens and the highest click rate of any window, 6.64%.
- 5Onboarding sequences show the same curve
Counting only onboarding sequence emails: 26% human opens in the first 24 hours, 13.6% in the next 24.
- 6After a week, half again
Emails sent more than seven days after signup got 7.9% human opens. This window draws on a narrower mix of senders, so read it as directional.
Full table
Every window in one place
| Sent after signup | Delivered | Raw open | Human open | Human click | Unsubscribe |
|---|---|---|---|---|---|
| First 24 h | 4,694 | 42.0% | 24.1% | 6.28% | 1.38% |
| 24 to 48 h | 3,826 | 33.8% | 13.8% | 4.03% | 1.93% |
| 48 to 72 h | 2,349 | 34.1% | 15.5% | 3.49% | 2.09% |
| Day 3 to 7 | 2,766 | 37.7% | 15.1% | 2.42% | 1.23% |
| After day 7 | 5,962 | 27.6% | 7.9% | 3.04% | 0.54% |
Unsubscribes rise from 1.38% on day one to about 2% on days two and three, then fall as the remaining audience settles. Every window has at least 2,300 delivered emails.
What to do with this
How to use the first day
Send the important email first
Put the one action that matters most in the first email, not the third. That is where opens and clicks are highest.
Send on behavior, not on a timer
A second email triggered by what the user did on day one lands while they are still deciding. Meisa triggers start from a product event, not a calendar.
Judge day two on clicks
Opens look steady after day one, but clicks keep falling, to well under half by days three to seven. Measure later onboarding emails by clicks and product use.
Methodology
How we measured it
Emails. Lifecycle emails only: onboarding sequences, behavior triggers and product notifications sent through the API. Broadcasts to whole lists are left out. Hours since signup is the gap between the contact's signup time and the send time.
Opens and clicks. The same bot filtering as the True Open Rate Report: scanner signatures, Apple's proxy and other opens within 10 seconds of delivery are removed, with welcome emails exempt from the speed rule. Unsubscribes are counted against the last email the contact received in the seven days before.
Anonymization. Every window shown has at least 300 delivered emails, and no sender can be identified. See the full research methodology.
FAQ
Common questions
When should a SaaS onboarding email go out?
As early as you can. Emails sent in the first 24 hours after signup got a 24.1% human open rate and a 6.28% click rate. Emails sent the next day got 13.8% and 4.03%.
Is the hot window after signup 24 hours or 72 hours?
In this data it is the first 24 hours. After day one, open rates flatten at around 14% to 16% until day seven, and click rates keep falling: 4.03% on day two, 3.49% on day three and 2.42% from day three to seven.
Is the first-day number just the welcome email?
Partly. Without the welcome email, first-day emails still had an 18.4% human open rate and the highest click rate of any window, 6.64%.
Do longer onboarding sequences work better than short ones?
Spacing matters more than length. Sequences of 2 to 3 emails spread over 6 to 10 days got 7.15% clicks per email, against 4.08% for sequences packed into 3.5 days, with the same open rate. See the onboarding sequence length study.
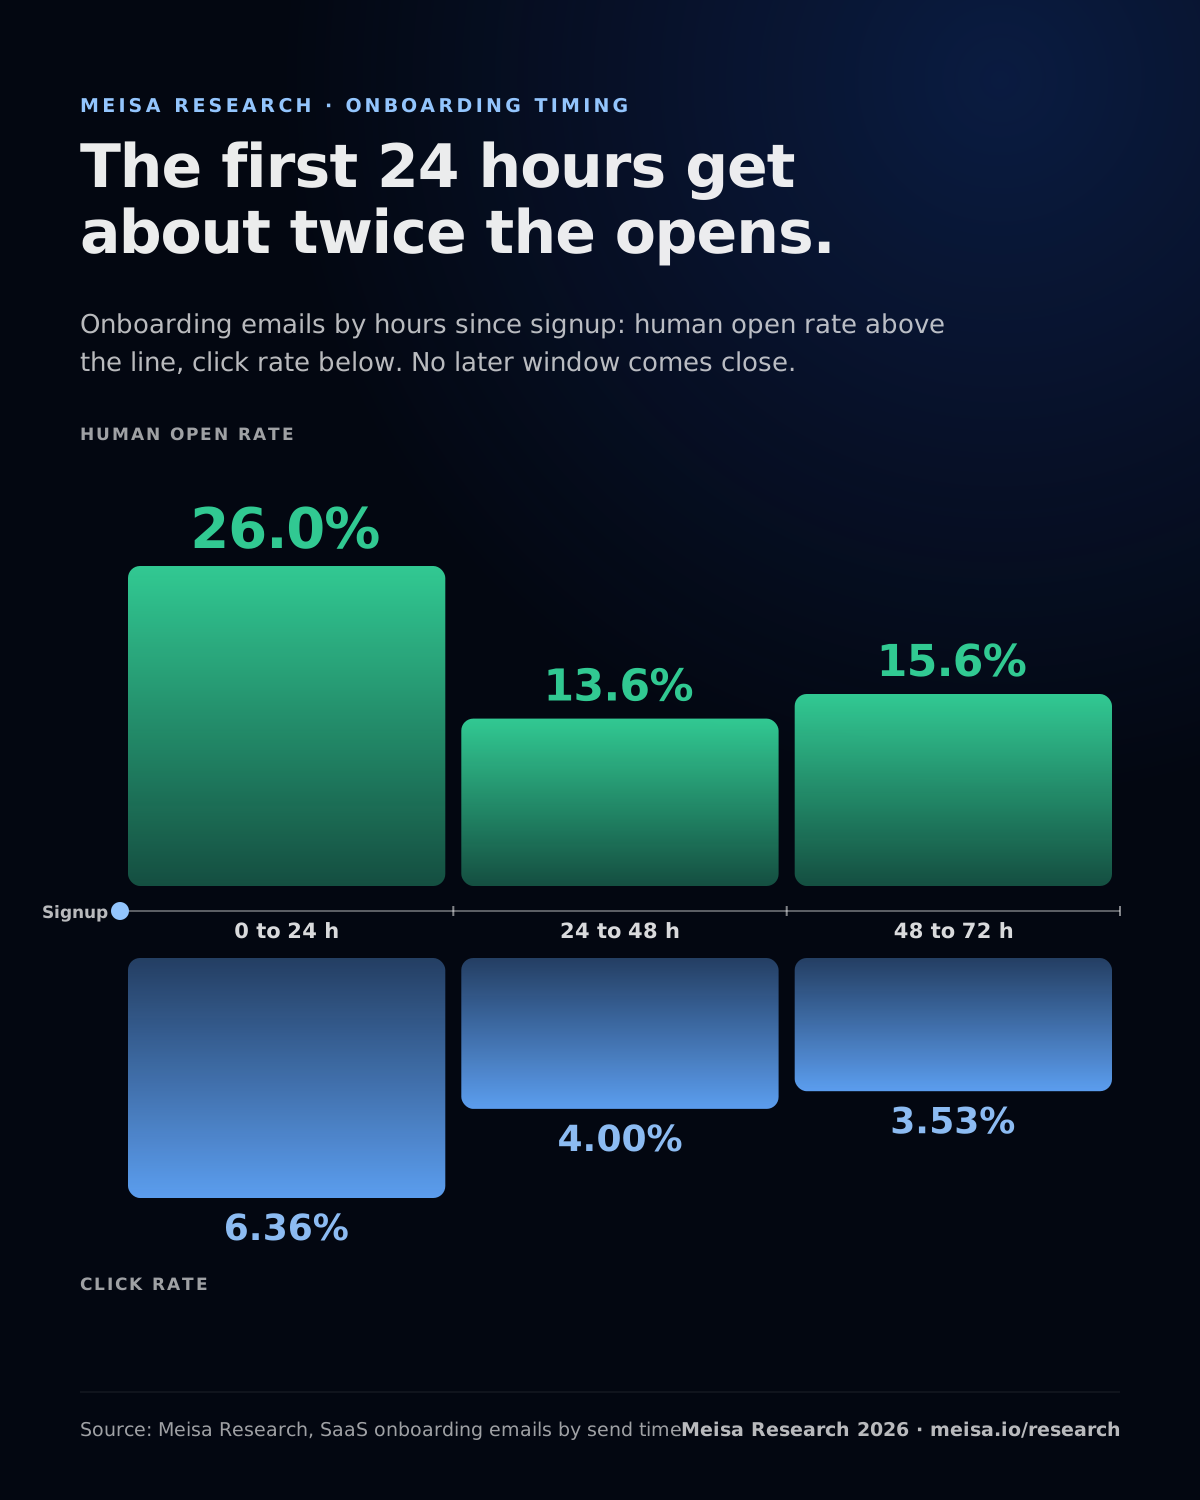
Onboarding email performance by hours since signup
Free to share in a post, deck or article with a link back to this page.
Download the infographic (SVG)Cite this research
Quote it, chart it, link it
Meisa (2026). The first 24 hours after signup. Meisa Research. https://meisa.io/research/onboarding-timing
<a href="https://meisa.io/research/onboarding-timing">The first 24 hours after signup</a> (Meisa Research, 2026)
Lifecycle emails sent in the first 24 hours after signup had a 24.1% human open rate and a 6.28% human click rate, against 13.8% and 4.03% for emails sent 24 to 48 hours after signup (Meisa Research, 2026, 19,597 delivered emails).
Free to quote, chart and republish with a link back to this page (CC BY 4.0).
Catch new users on day one
Meisa sends onboarding emails the moment a signup or product event happens, and shows you which ones real people opened.